Quantitative finance
Equity Options Analytics.
An exploration of market data, option pricing, and the mathematics behind risk. Built to make the assumptions as visible as the results.
THE OVERVIEW
What’s the idea?
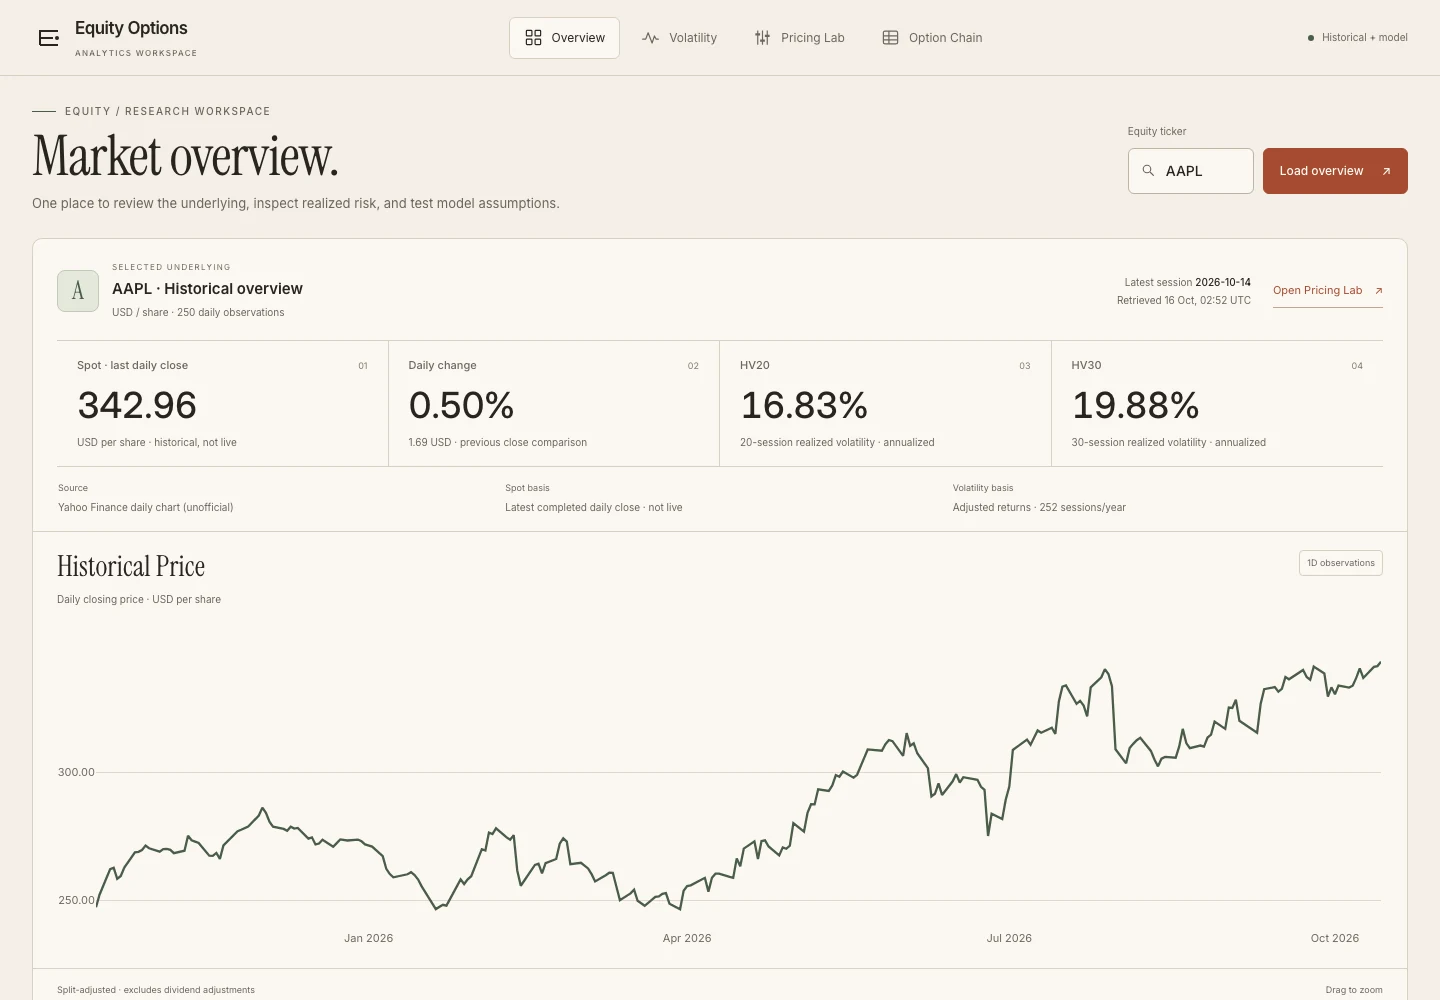
A learning-focused analytics workspace for equity-options fundamentals, bringing historical equity data, realized volatility, and a European options pricing lab into one interface.
The problem.
A single option price says little without the volatility, time horizon, and sensitivities behind it.
The approach.
A Python analytics layer calculates the models, while a Next.js interface brings inputs, charts, methodology, and limitations together.
INSIDE THE BUILD
Details that matter.
Historical perspective
Ticker-based historical prices, latest completed daily close, and 20- and 30-day realized volatility.
A transparent pricing lab
Dividend-adjusted European Black–Scholes pricing with editable call and put assumptions.
Risk, made visible
Delta, Gamma, Vega, Theta, and a selected Greek-versus-spot chart.
Explicit boundaries
Closing prices are distinguished from live quotes. The option chain is marked as planned.
TECHNICAL FLOW / A HIGH-LEVEL VIEW
- 01
Next.js interface
- 02
FastAPI endpoints
- 03
Python models
- 04
Historical market data
KEEP EXPLORING / NEXT PROJECT